Not what you're looking for? Try the first set of demos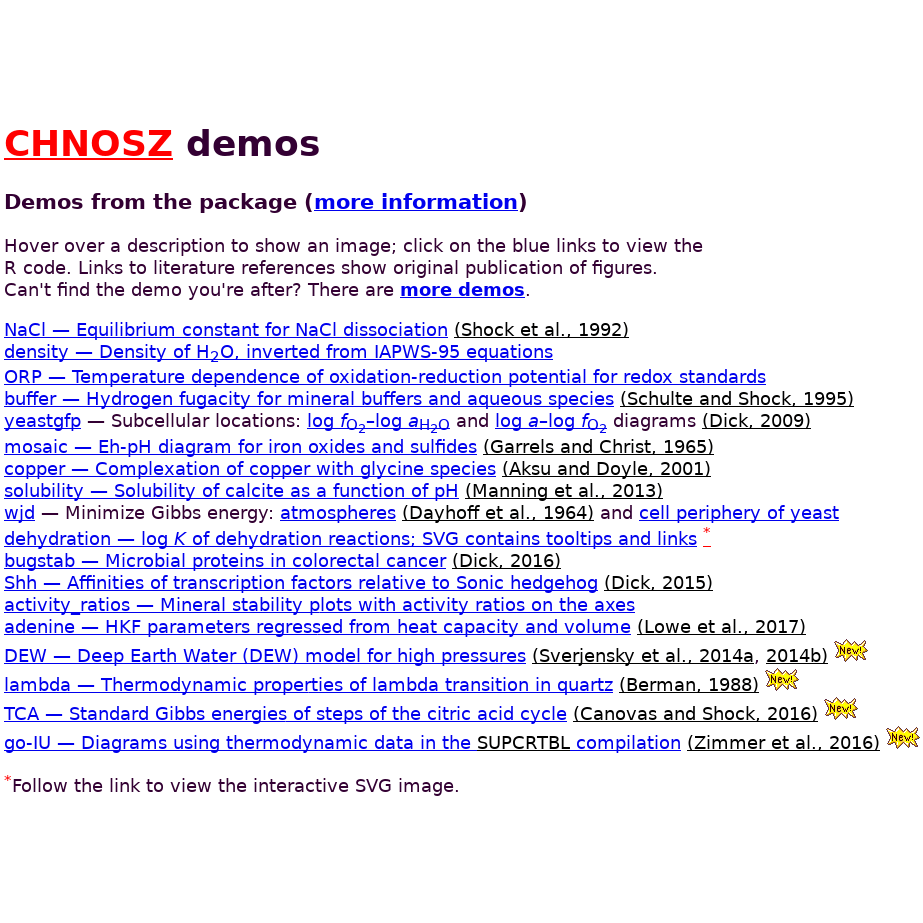 .
.
Hover over a description to show an image; click on the blue links to view the R code.
glycinate — Metal-glycinate complexes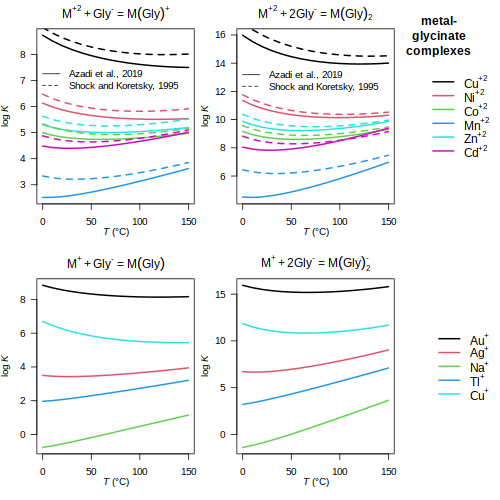
(
Azadi et al., 2019
;
Shock and Koretsky, 1995
)
copper — Complexation of copper with glycine species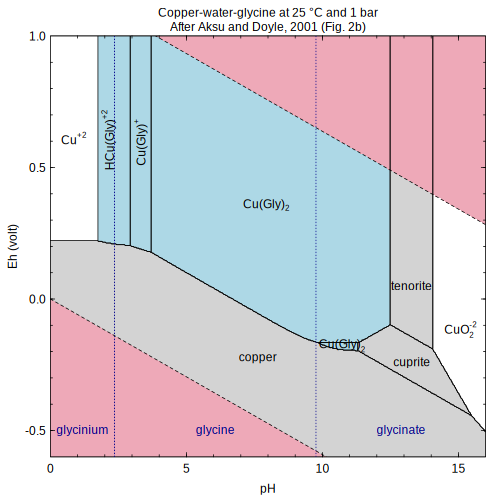 (Aksu and Doyle, 2001)
 affinity
 —
Amino acid synthesis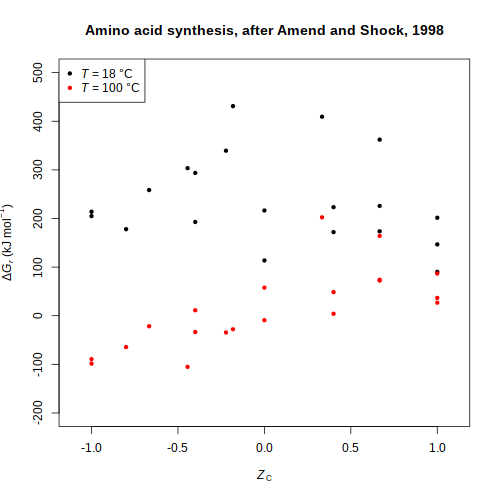
and
Aquifex metabolism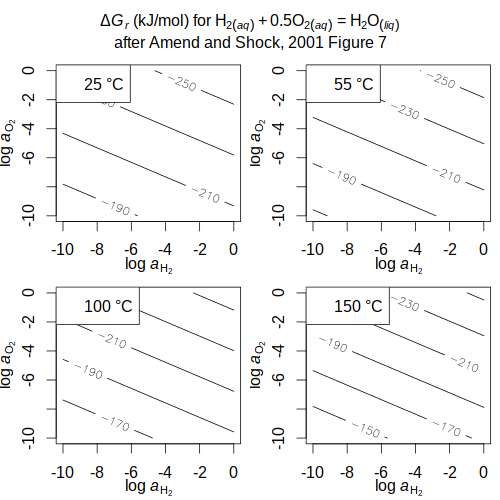 (Amend and Shock, 1998
,
2001) buffer — Hydrogen fugacity for mineral buffers and aqueous species
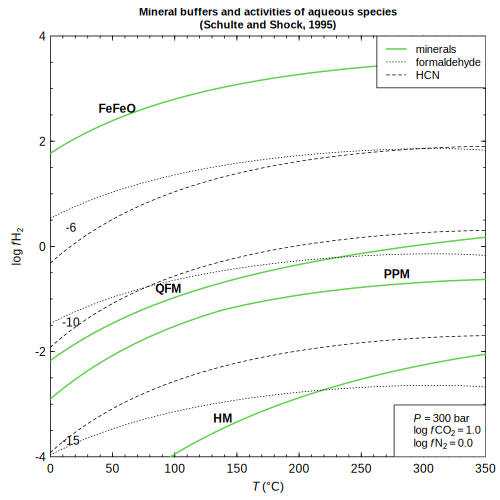 (Schulte and Shock, 1995)
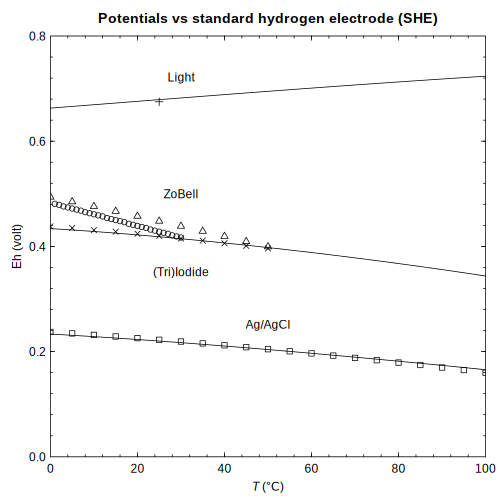
 ORP — Temperature dependence of oxidation-reduction potential for redox standards
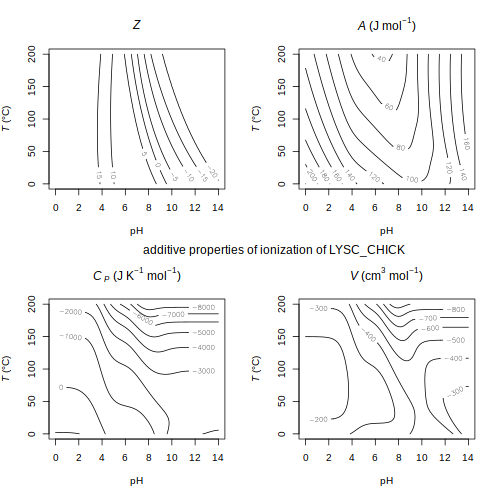
 ionize — Contour plots of net charge and ionization properties of LYSC_CHICK
 protbuff
 — Hypothetical buffers of bacterial
thiol peroxidases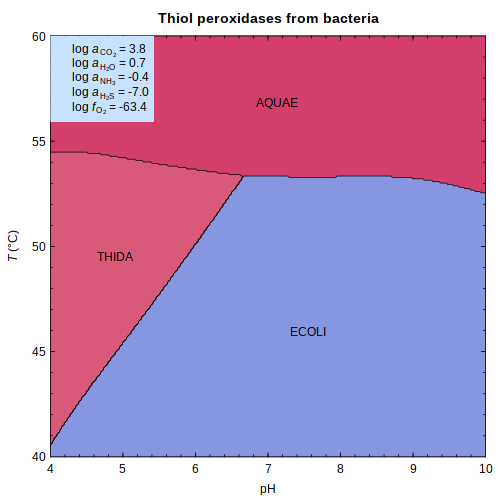
or
sigma factors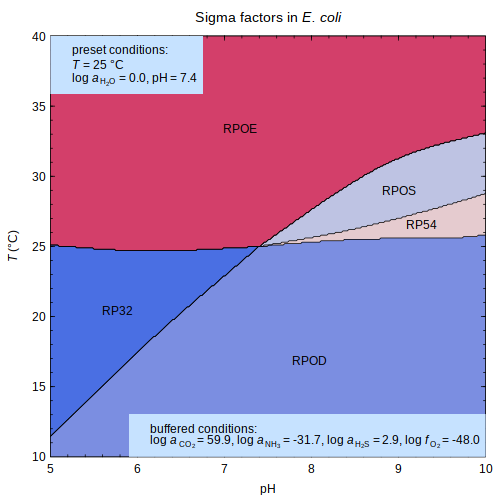
in
E. coli
carboxylase — Rank abundance distribution for RuBisCO and acetyl-CoA carboxylase (animated GIF)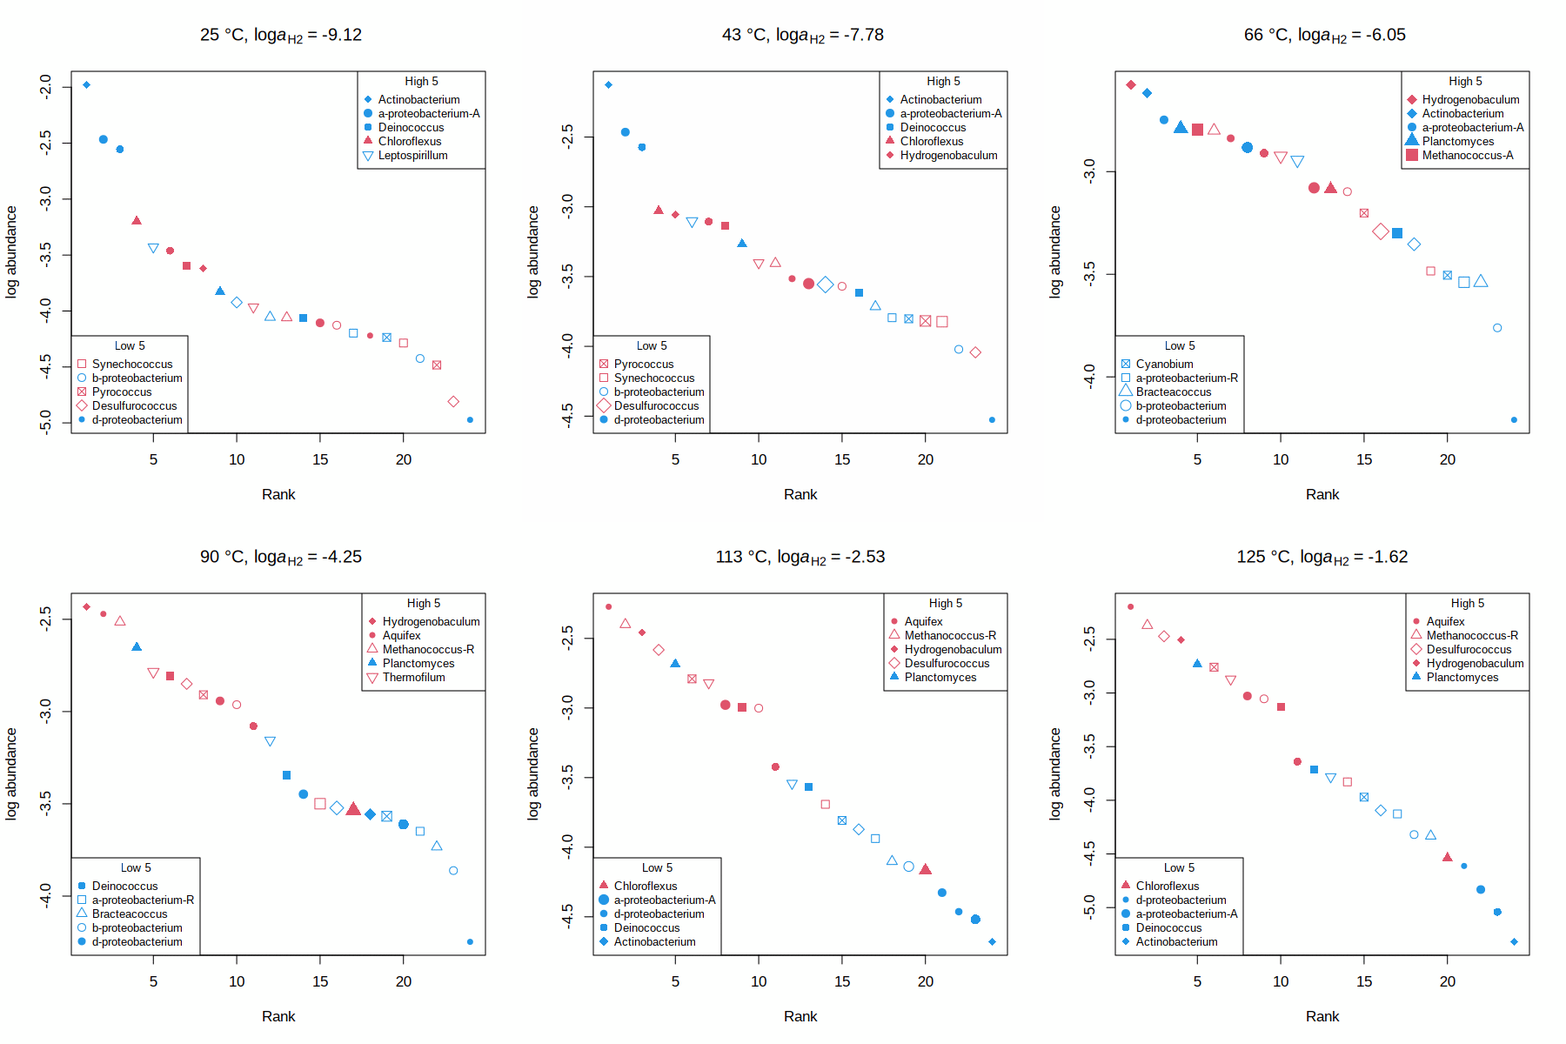 Shh — Affinities of transcription factors relative to Sonic hedgehog
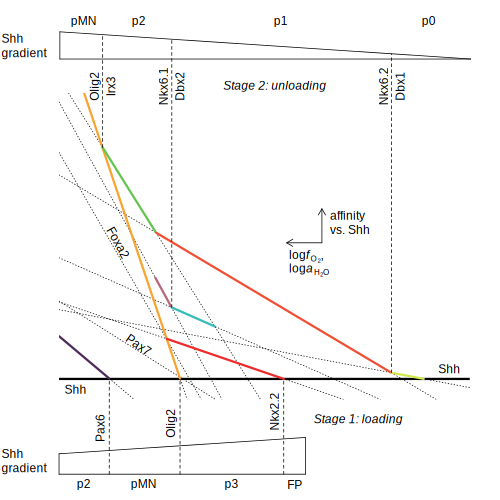 (Dick, 2015)
 dehydration — log K of dehydration reactions; SVG contains tooltips and links
 *
TCA — Standard Gibbs energies of steps of the citric acid cycle
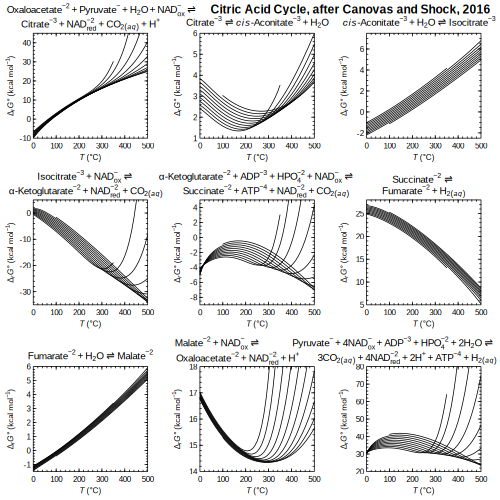 (Canovas and Shock, 2016)
 adenine — HKF parameters regressed from heat capacity and volume
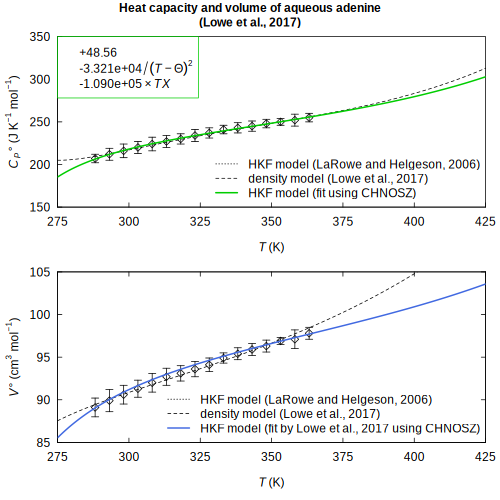 (Lowe et al., 2017)
 comproportionation — Gibbs energy of sulfur comproportionation
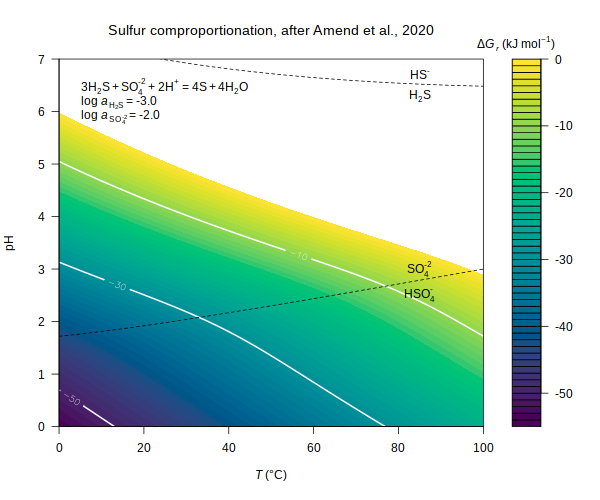 (Amend et al., 2020)
 E_coli — Gibbs energy of biomass synthesis in E. coli
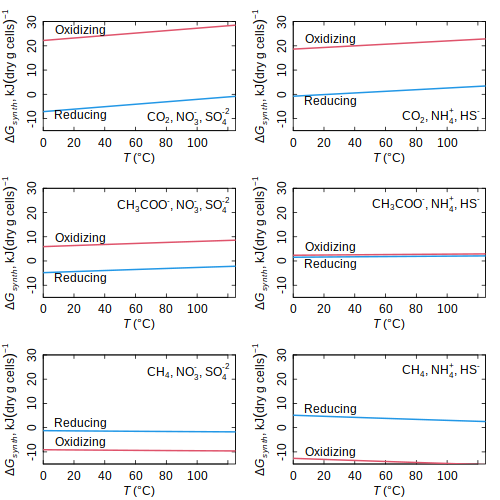 (LaRowe and Amend, 2016)
 rank.affinity — Affinity ranking for proteins
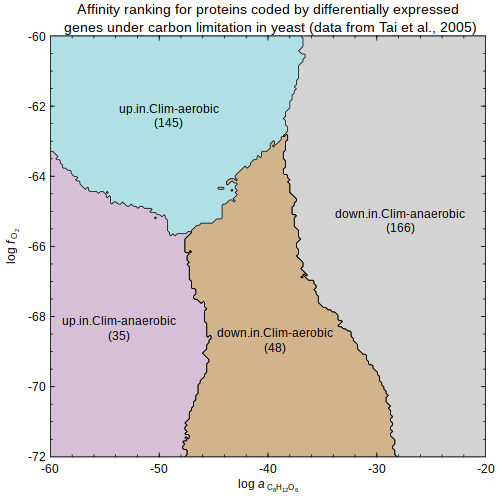
(gene expression data from
Tai et al., 2005
)
Last updated: 2025-06-25
 .
. .
. (Azadi et al., 2019
 ; Shock and Koretsky, 1995
 )
) (Aksu and Doyle, 2001)
 and Aquifex metabolism
 (Amend and Shock, 1998
 , 2001)
 (Schulte and Shock, 1995)


 or sigma factors
 in E. coli
 (Dick, 2015)
 *
* (Canovas and Shock, 2016)
 (Lowe et al., 2017)
 (Amend et al., 2020)
 (LaRowe and Amend, 2016)
 (gene expression data from Tai et al., 2005
 )
)