CHNOSZ
Thermodynamic calculations and diagrams for geochemistry
 Thermodynamic database with minerals and inorganic and organic aqueous species.
 Balance reactions with basis species, calculate standard Gibbs energy, equilibrium constant, and chemical affinity.
 Make Eh–pH, logfO2–pH, and other types of chemical activity diagrams.


What is it?
The CHNOSZ package for R provides an integrated set of tools for thermodynamic calculations in aqueous geochemistry and geobiochemistry. It has functions for writing balanced reactions to form species from user-selected basis species and for calculating the standard molal properties of species and reactions, including the standard Gibbs energy and equilibrium constant (details). Calculations of the non-equilibrium chemical affinity and equilibrium chemical activity of species can be portrayed on diagrams as a function of temperature, pressure, or activity of basis species; in two dimensions, this gives a maximum affinity or predominance diagram. The diagrams have formatted chemical formulas and axis labels, and water stability limits can be added to Eh-pH, logfO2-T, and other diagrams with a redox variable. The package has been developed to handle common calculations in aqueous geochemistry, such as solubility due to complexation of metal ions, mineral buffers of redox or pH, and changing the basis species across a diagram ("mosaic diagrams"). CHNOSZ also implements a group additivity algorithm for the standard thermodynamic properties of proteins.
An Example
Based on a figure from Yang et al. (2018)
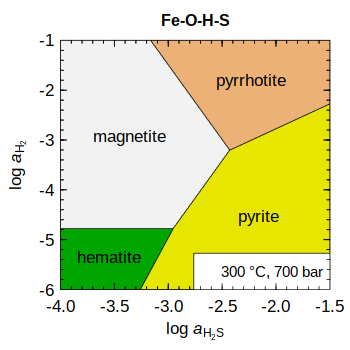
add.OBIGT("SUPCRT92")
basis(c("Fe", "H2", "H2S", "H2O"),
  c("cr", "aq", "aq", "liq"))
species(c("hematite", "pyrite",
  "pyrrhotite", "magnetite"))
a <- affinity(H2S = c(-4, -1.5),
  H2 = c(-6, -1), T = 300, P = 700)
diagram(a, fill = "terrain")
title(main = "Fe-O-H-S")
legend("bottomright",
c("300 °C, 700 bar"))Documentation
- NEWS — version 2.2.0 released on 2025-06-20
- Vignettes, including:
- CHNOSZ FAQ

- An Introduction to CHNOSZ
- OBIGT thermodynamic database
- Diagrams with multiple metals
- Carrollite vignette in the JMDplots package
- CHNOSZ FAQ
- Demos and more demos
- Manual in HTML and PDF format
- Plots from examples
- A table of references for thermodynamic data, made using
thermo.refs() - A table of thermodynamic data in CSV format, made using
dumpdata("alldata.csv")
Installation
- Get R from the Comprehensive R Archive Network (CRAN).
- Start an R session, then use these commands to install and load the package and run the examples from the help files:
- To install the development version, use this command instead:
install.packages("CHNOSZ")
library(CHNOSZ)
examples()
install.packages("CHNOSZ",
  repos = "https://R-Forge.R-project.org")
Weblinks
- R-Forge: Development site
- CHNOSZ paper in Frontiers in Earth Science
- Citations: Publications that cite CHNOSZ
- Demo Shiny apps by Jeffrey Dick: citrate, comproportionation