Data Visualization by Jeffrey Dick
Tap an image to view the full-size version. Tap again to return to this page.-
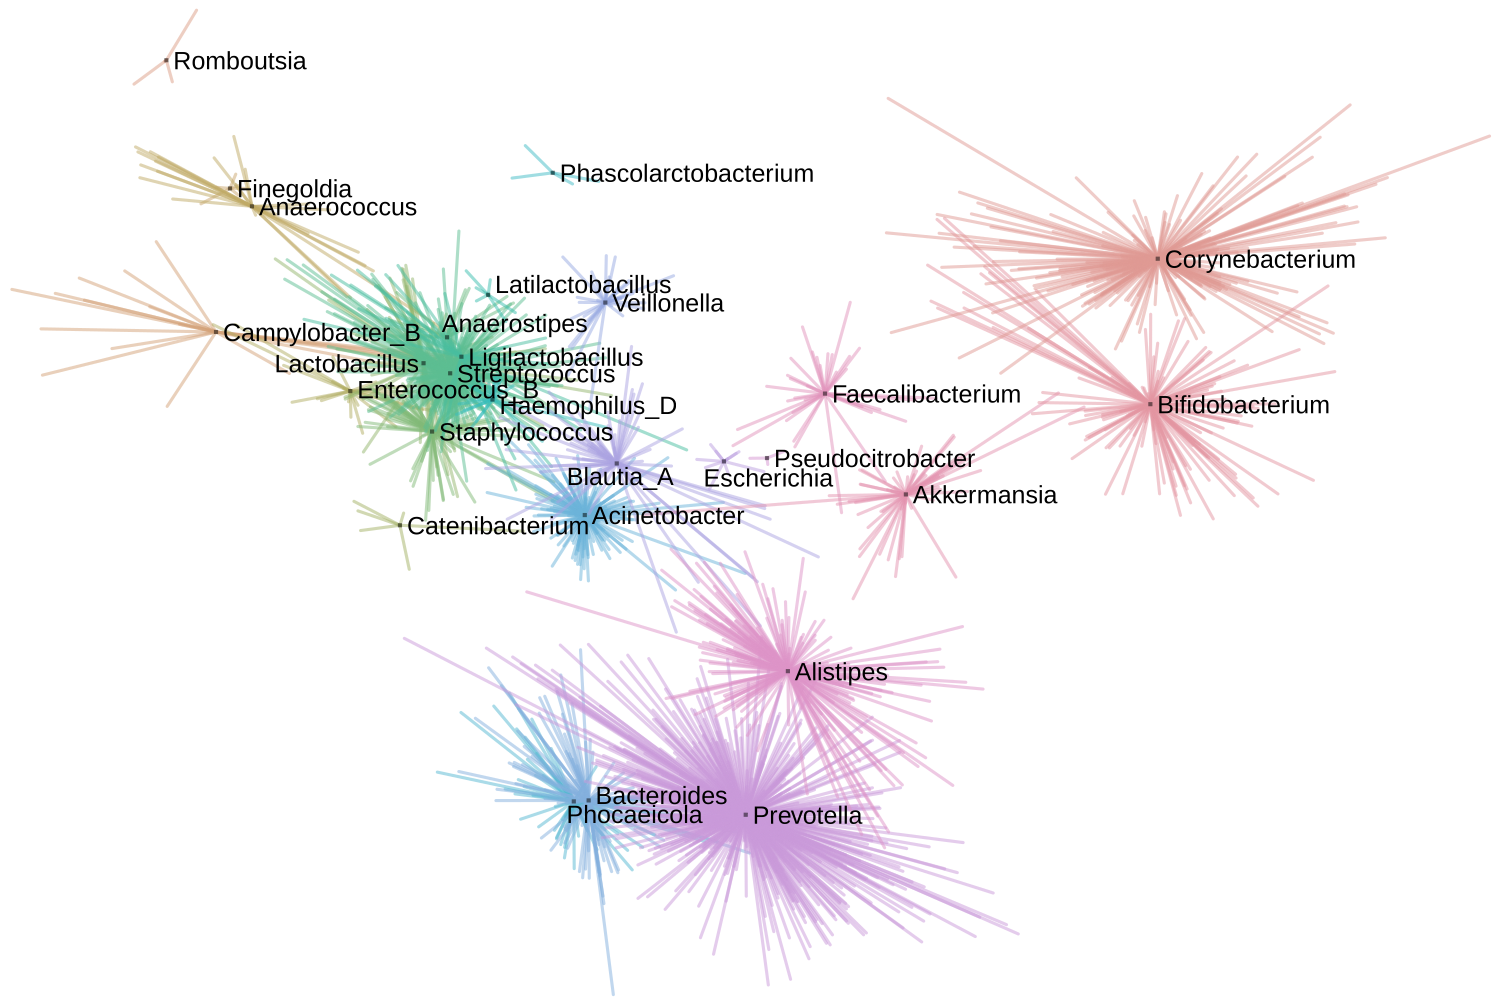
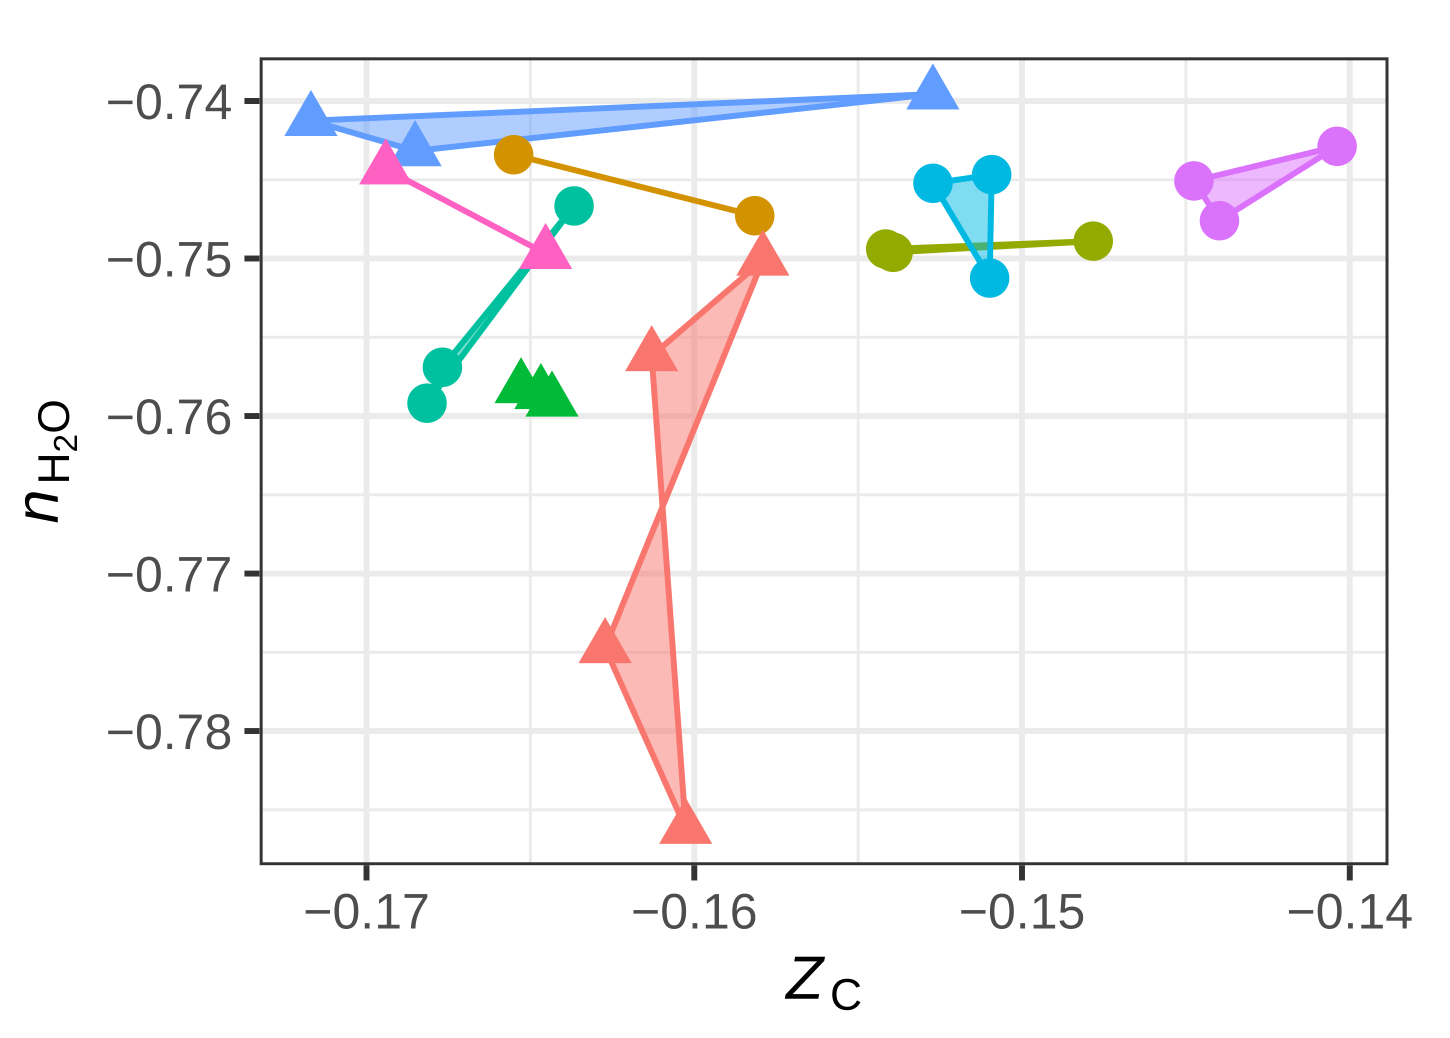
Imagine that you are looking at a tree from above. The Starburst Plot represents the top surface of an evolutionary tree in order to see differences and overlaps between groups of species.
publication · code · documentation -
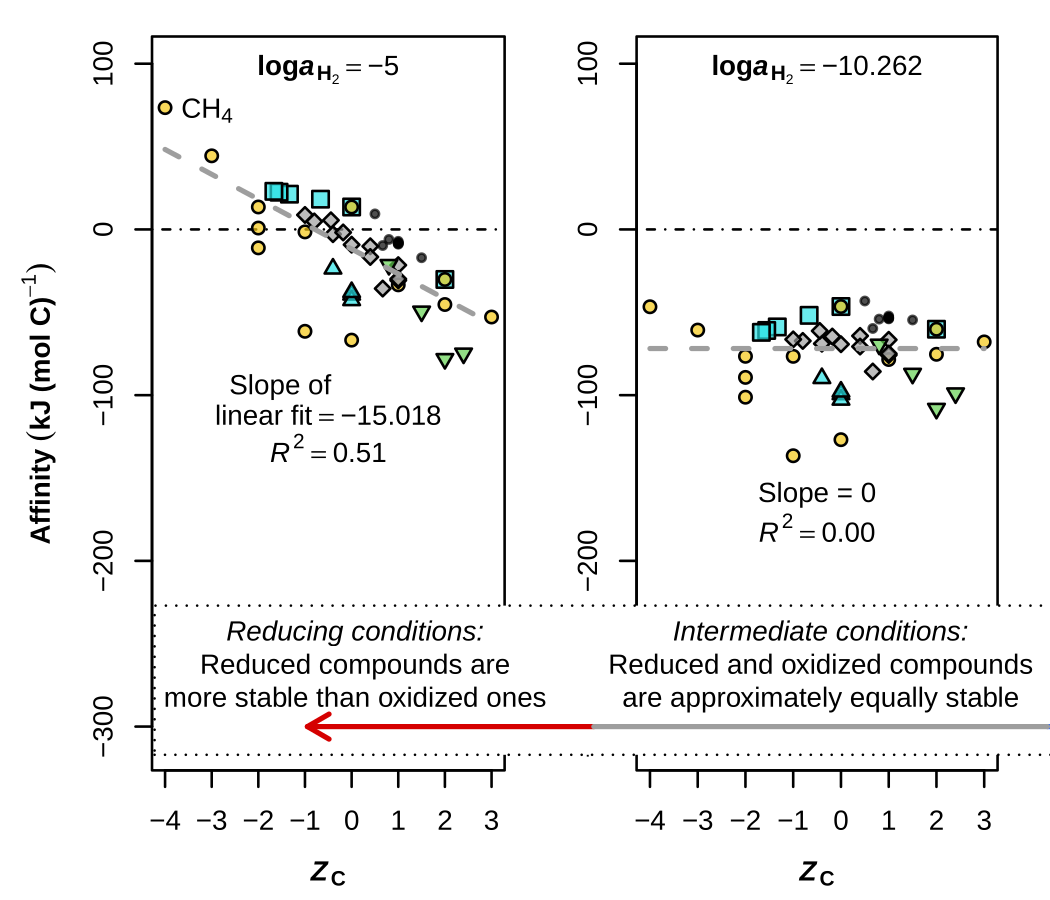
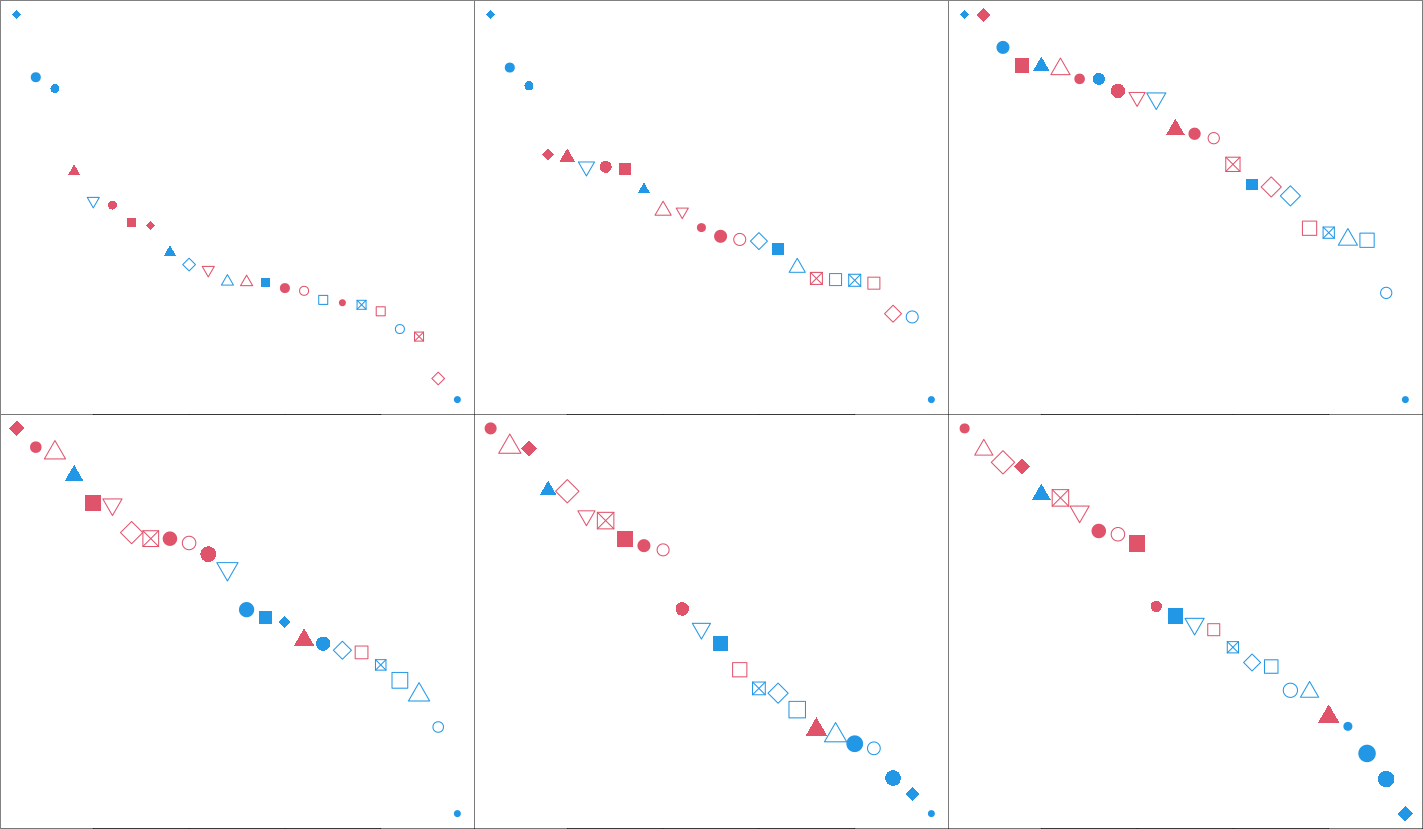
Neutral pH is an important concept in chemistry, but no direct counterpart exists for oxidation-reduction (redox) reactions. The Affinity Slopes plot is used to find a midpoint on the redox scale; it is where reduced and oxidized organic compounds have nearly equal stabilities.
website · publication · code -
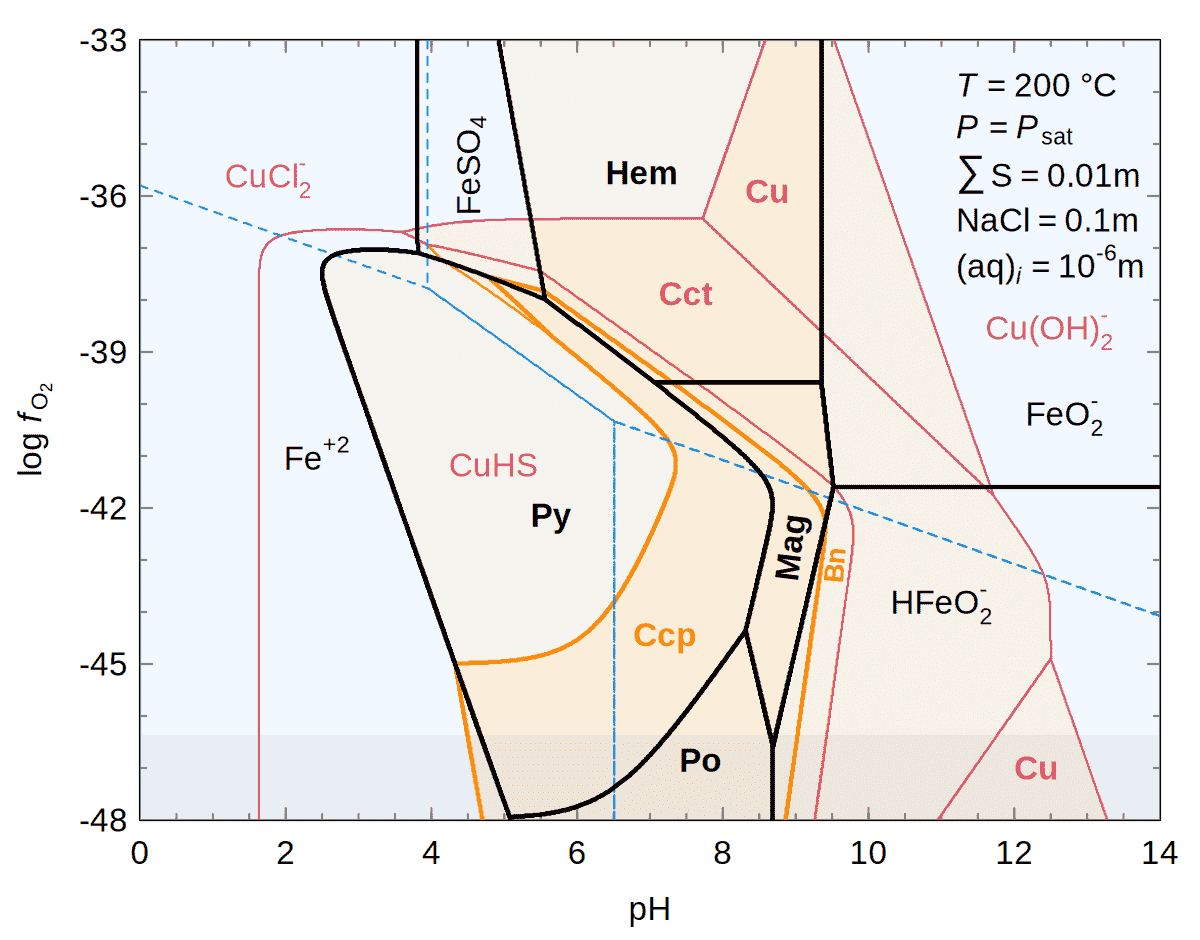
The Stability Diagram reveals how minerals with different elements (bold text colors) dissolve in water (blue areas) under specific conditions (plot axes).
website · publication · code -
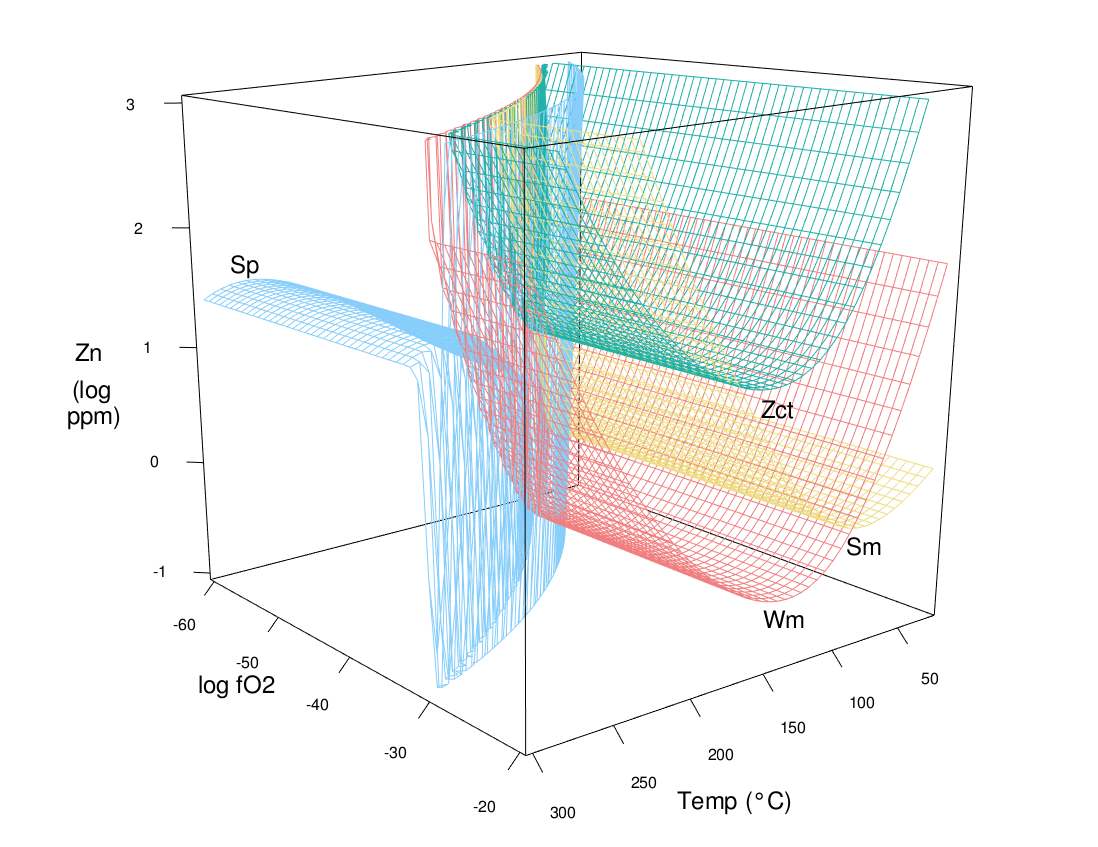
Zinc 3D is looking through a stability diagram; the third dimension (z direction) is used to predict high-energy states. This example is inspired by 3D plots in Brugger et al., 2003. Check out the interactive plot.
-
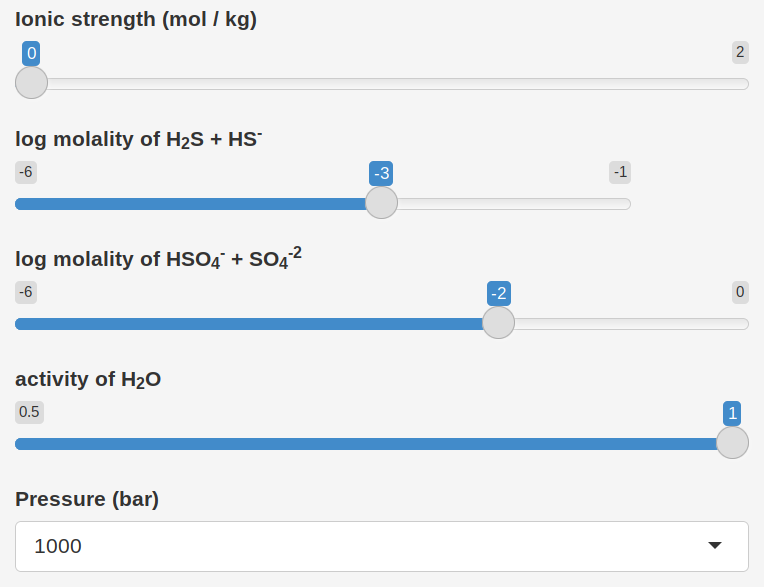
With this Shiny App the user can adjust five variables to see how they affect reaction energy. The base plot was published by Amend et al., 2020. I am responsible only for the app itself and some tweaks to the plot.
live at shinyapps.io -
The Abundance Animation connects simulated ecological data to environmental change (tap image to open the animation).
website · code -
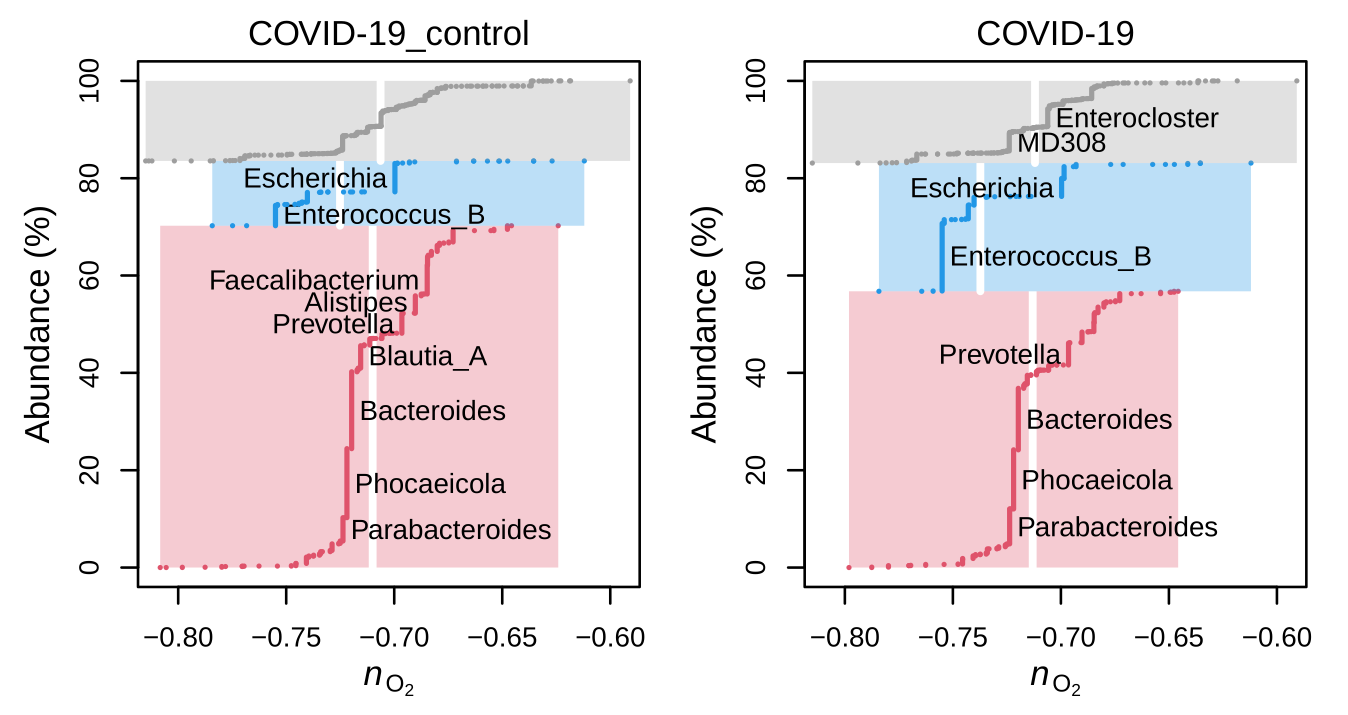
Abundance Stacks are used to visualize within-group and between-group variation not only of abundance but also of a chemical metric.
publication · code -
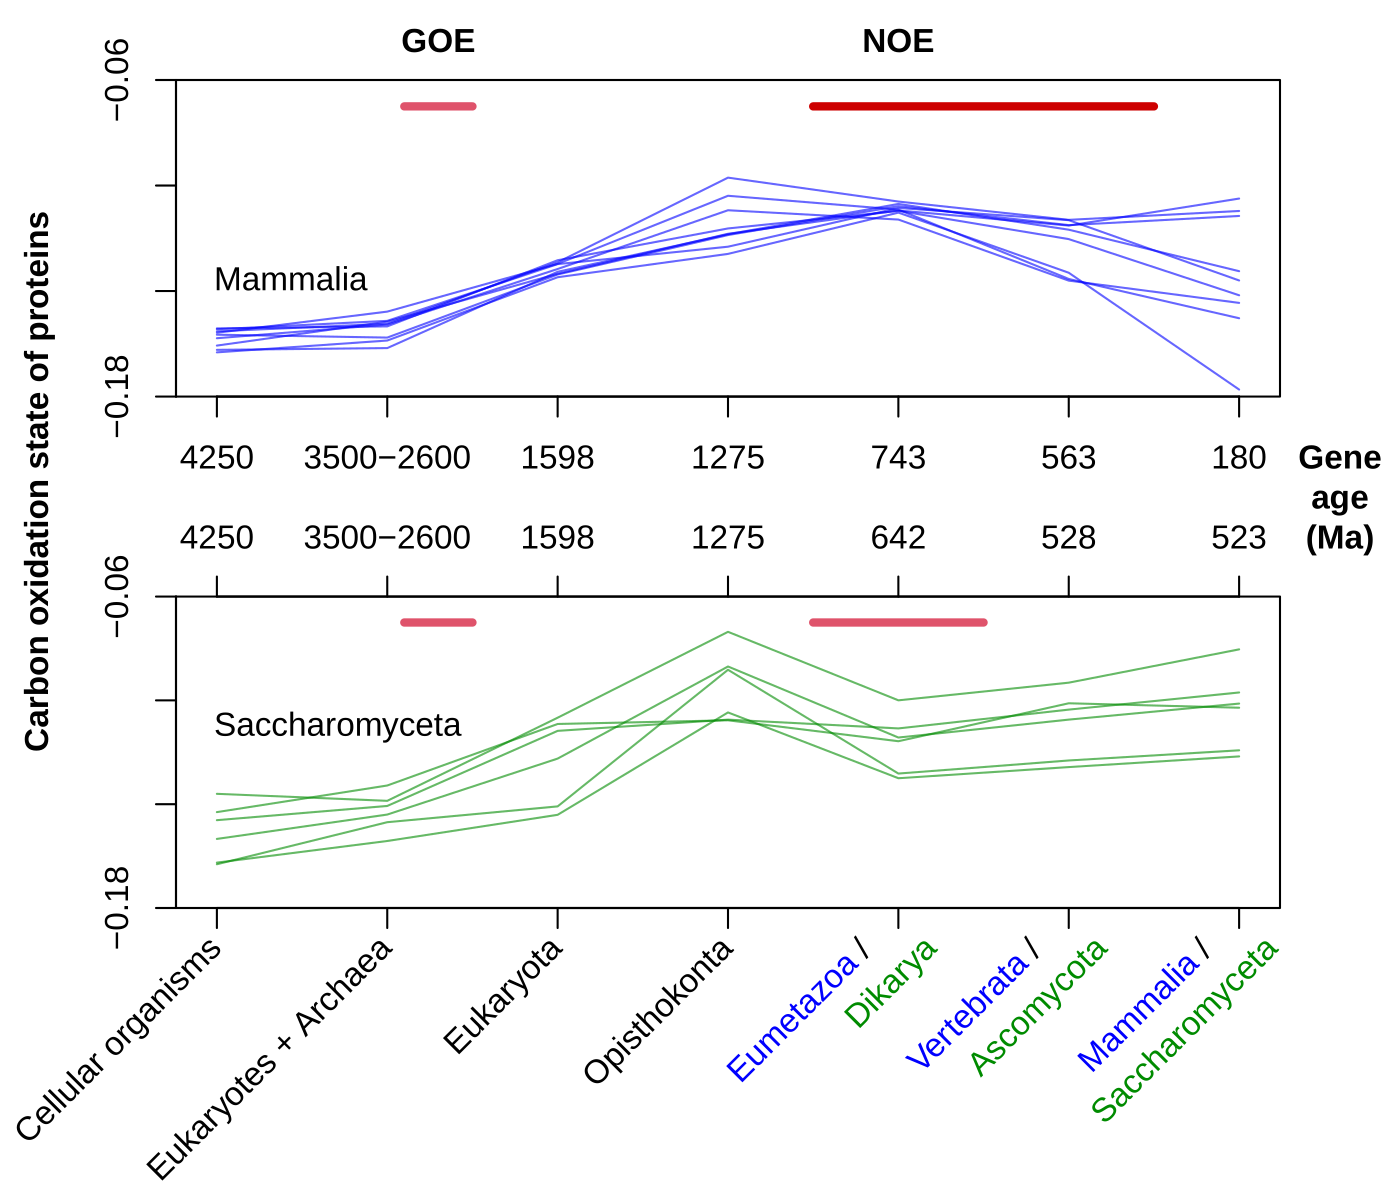
Deep Time shows parallel trends for evolutionary lineages during the Great Oxidation Event (GOE) and diverging trends during the Neoproterozoic Oxidation Event (NOE). The key design features are the use of a separate panel and color for each lineage and shared colors and scales to indicate features common to both lineages.
code -
A vertical trend associated with hydration state becomes a sloped trend after virtually Splitting Water into its elements. This visualization is useful for finding the primary chemical variables that influence genome evolution.
publication · code
